Put a symbol's volatility in context
Compare one symbol's volatility risk premium with its own history on three charts, then read today's values in the Stats Panel.
Goal
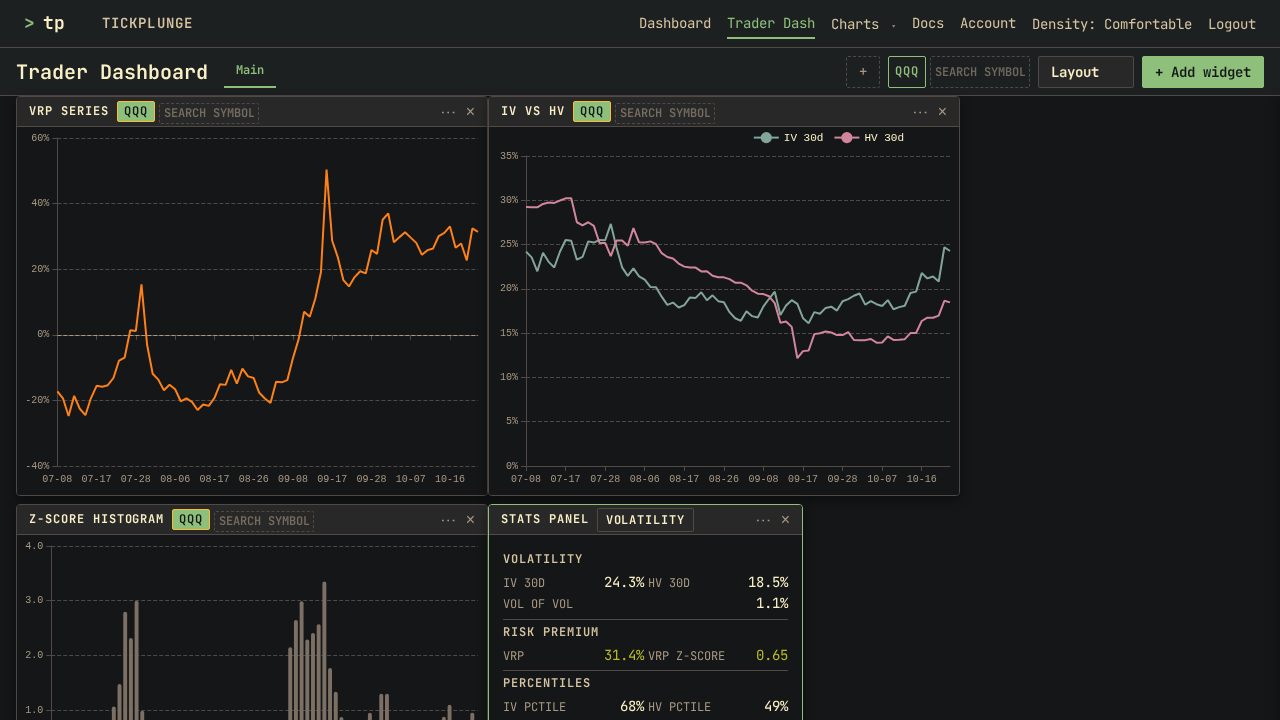
Show one symbol's volatility risk premium in four widgets. VRP Series shows its history inside sigma bands, IV vs HV the two volatilities behind it, and Z-Score Histogram its daily z-score. The Stats Panel shows today's values.
Before you start
Sign in and click Trader Dash in the top bar. The steps use QQQ; every symbol works the same way. In each picture, the window was widened by dragging its right border.
Steps
-
Click the search field in the symbol row at the top of the page, then type
QQQ. -
Press Enter. The symbol row now shows QQQ.
-
Click + Add widget, then under Charts click VRP Series, IV vs HV and Z-Score Histogram.
-
Under Widgets, click Stats Panel, then press Escape to close the picker. Every widget draws QQQ.
-
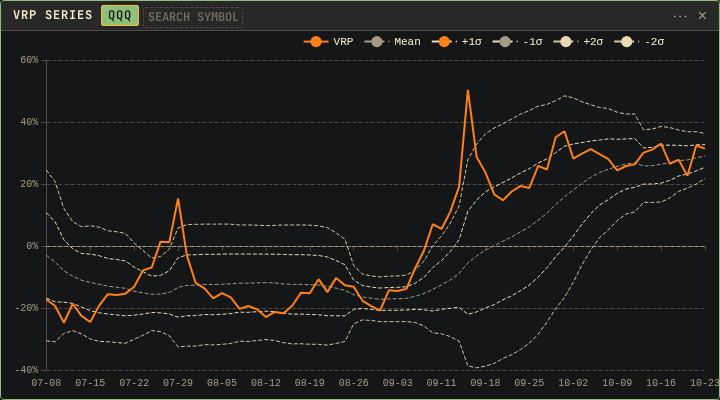
On VRP Series, click the widget menu button (⋯). Under Display, in Sigma bands, click 2σ.
-
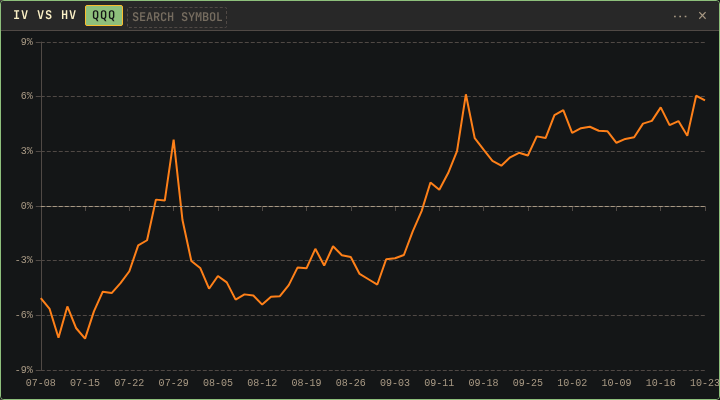
On IV vs HV, open the widget menu. Under Display, click Spread.
-
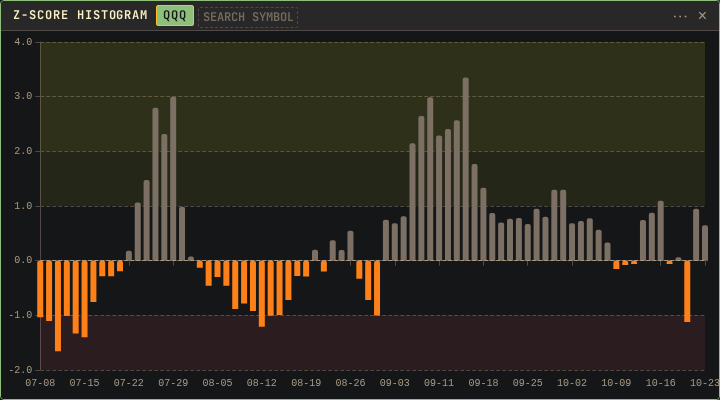
On Z-Score Histogram, open the widget menu. Under Display, in Zones, click On.
-
Read the Stats Panel. It opens on the Volatility preset.
Result
VRP Series draws VRP for each trading day. 2σ adds the 20-day mean and lines at one and two standard deviations above and below it. A point above the upper lines is high compared with the symbol's last 20 days.
IV vs HV with Spread draws one line: 30-day implied volatility minus 30-day historical volatility. A value above zero means that options are priced above the moves the stock has made.
The Z-Score Histogram draws one bar per day. Each bar is the distance of that day's VRP from its 20-day mean, in standard deviations. Zones shades the bands from 1 to 2 and beyond 2, on both sides of zero.
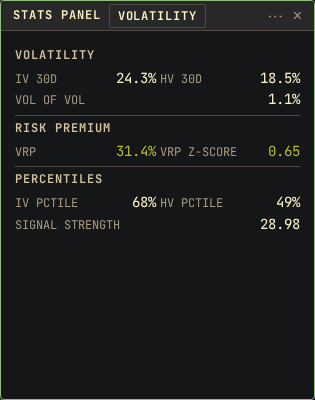
The Stats Panel shows the latest day's values. In the pictures QQQ's implied volatility is 24.3% and its historical volatility is 18.5%, so VRP is 31.4%. The z-score of 0.65 is inside the unshaded band. Implied volatility is at its 68th percentile and historical volatility at its 49th.
The four widgets do not suggest a strike, expiry or trade.
The VRP on these charts is a ratio. The Volatility Board VRP and a card's VRP points are differences in volatility points. For the same symbol and day, the three values are different numbers.
Other ways
Compare years
VRP Series and Z-Score Histogram list Year overlay under Display: None, 1Y, 2Y or 3Y. IV vs HV lists the same options as No Overlay to 3Y Overlay. An overlay draws one line per year, aligned by trading day. Compare symbols describes the overlay and Compare on IV vs HV.
Other presets
The preset list in the Stats Panel header also lists Distribution, Greeks, VIX, Regime, Signal and Vol Surface. Each preset shows a different set of values for the same symbol.
If something goes wrong
- The chart shows only the last few months: each chart opens on the most recent 30% of its Range. Scroll on the plot to zoom out.
- Sigma bands or Zones draw nothing: a year overlay is on. Set Year overlay back to None.
- Zones draw nothing with no overlay on: Compare is on. Turn it off under Data in the widget menu.
- The z-score line starts late: the first 19 days have no full 20-day window. The z-score has no value there, and the chart draws a gap.