Start here
What the site shows, the age of each number, and a ten-minute tour from sign-in to your own dashboard.
What the site shows
TickPlunge shows analysis of US options data. The data covers implied and historical volatility, the volatility surface, the implied distribution of prices and option greeks. It also covers the related rates and macro series. Daily Dispatch is a morning summary of the day's notable values.
The site has no live quotes and no order entry.
How old a number is
One daily run builds every number on the site. The run starts at 00:15 UTC, Tuesday to Saturday, and retries at 00:30 New York time. It uses the option chains for the previous session. The Wednesday run covers Tuesday's session.
A number shown on Wednesday 2026-10-21 describes the close of Tuesday 2026-10-20 until Thursday's run finishes. Each number shows the trade date it belongs to. Read each number against its trade date.
Model scores have an extra lag. A model that scores a session uses only inputs from earlier sessions. The pipeline and the lag rule describes the lag rule in full.
Tour
The tour takes about ten minutes.
-
Click Log in in the top bar. If you are already signed in, go to step 4.
-
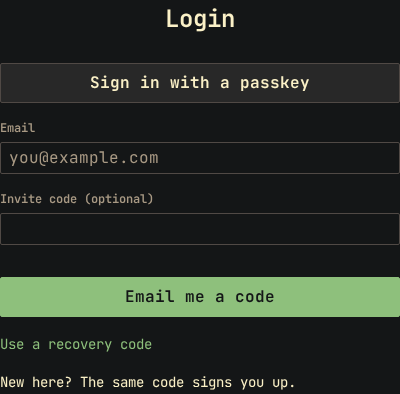
Type your email and click Email me a code.
-
Type the code from the email and click Continue. The same code signs up a new address. There is no password. If you have an invite code, type it in Invite code (optional) before step 2.
-
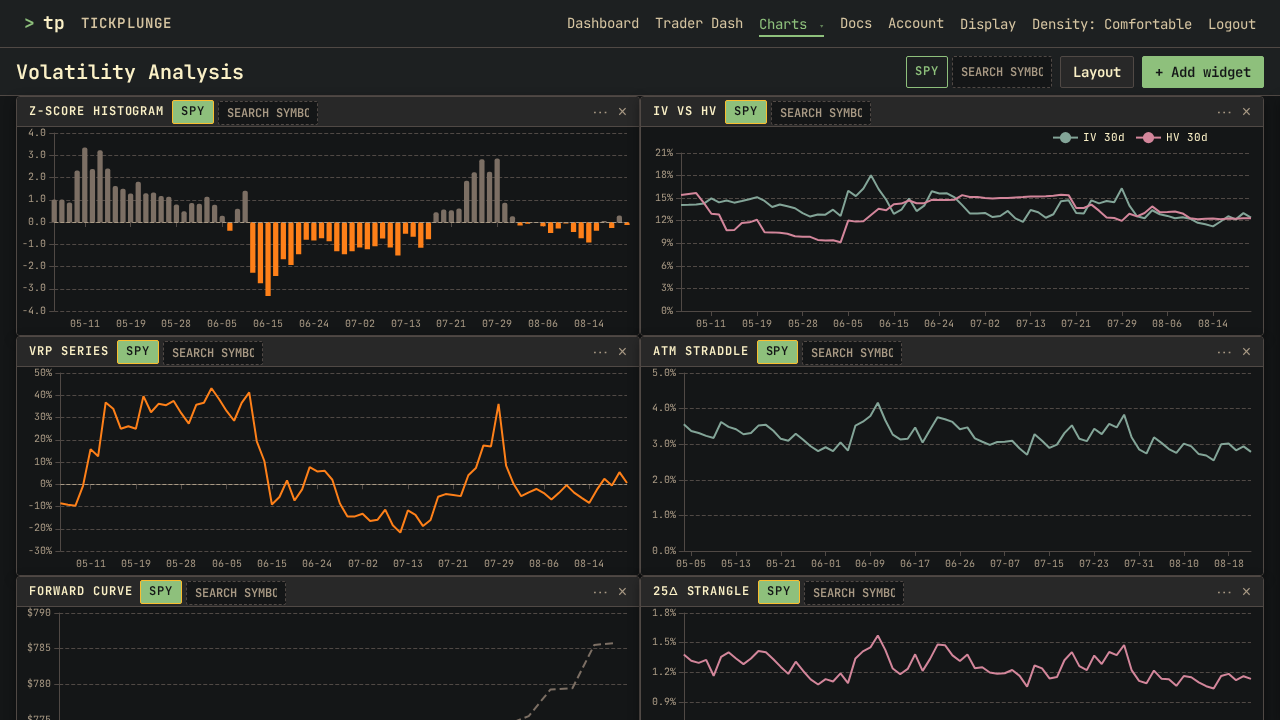
Click Charts in the top bar and select Analysis.
-
In the symbol row at the top of the page, type
QQQin the search field and press Enter. Every widget that follows the symbol row redraws on QQQ. -
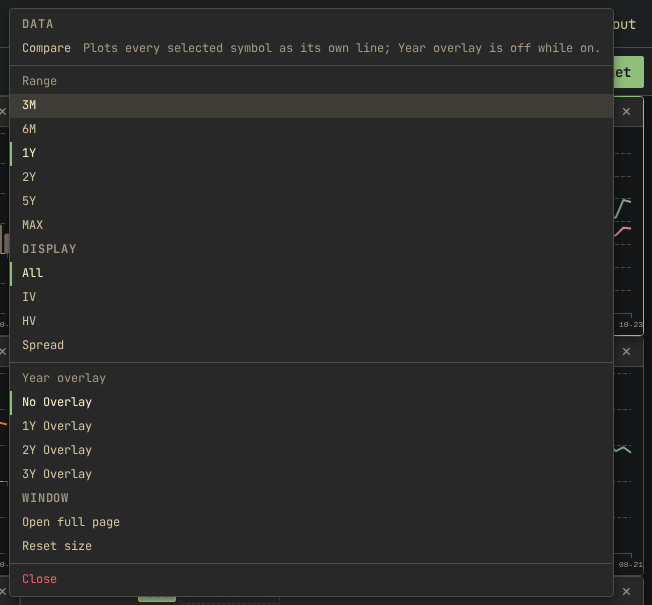
Click the widget menu button (⋯) at the top right of any widget. The menu groups its options under headings such as Data, Display and Window.
-
Click Trader Dash. Trader Dash opens empty. You add your own widgets to it.
-
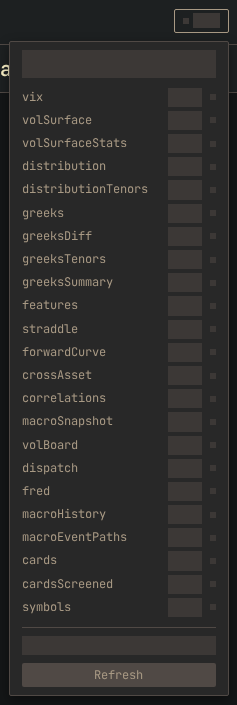
Click the cache pill in the top bar. The cache panel shows how much of the page's data your browser already has.
-
Click Docs to return to this page.
The pages
| Page | Opens with |
|---|---|
| Explorer | VIX 30-Day, VIX 3-Month, VIX Basis and Stats Panel |
| Analysis | IV vs HV, VRP Series, Z-Score Histogram, ATM Straddle, 25Δ Strangle, Forward Curve and Stats Panel |
| Vol Surface | Vol Surface 2D/3D, Term Structure, Vol Smile and Stats Panel |
| Distribution | Distribution |
| Greek Flow | two Greek Flow widgets and Stats Panel |
| Trader Dash | nothing; you add the widgets |
On every page, click + Add widget to add a widget and drag a widget by its title bar to move it. The page saves your arrangement automatically.
Where to go next
- Build and save a dashboard describes tabs, named layouts and links that open a widget.
- Compare symbols draws several symbols on one chart.
- Analyse one series uses a symbol's history in a formula.
- Make your first API call fetches the same numbers from your own code.
- Widgets, in the sidebar, has one page per widget under its window title, such as Volatility Board.
- Measures, in the sidebar, defines each number. The keyboard reference lists every key.
If something goes wrong
- No email arrives: check the spam folder, then request a new code. A code expires after 10 minutes.
- A chart shows no data for a symbol: the daily run has no valid data for that symbol on that date. Other symbols are not affected.
- A number looks a day old: numbers are from the previous session. Check the trade date. The next run starts at 00:15 UTC.
- A trade date is two or more sessions old: click the cache pill, then click Refresh to fetch the page's data again.