Compare two or more series
Align two histories on the same dates in the Calculator, then compute their correlation, their spread and the z-score of today's spread.
Goal
Compute the correlation of SPY and QQQ implied volatility in the Calculator, chart their spread over time, and compute the z-score of today's spread.
Before you start
Open Trader Dash. This guide uses 30-day implied volatility. Every
function that ends in .series works the same way.
Two histories rarely cover the same dates, so
iv30.series("QQQ") - iv30.series("SPY") stops with "series have
different dates". align(a, b) keeps only the dates that a shares with
b. Wrap each side of a subtraction in align, with the other series as
the second argument, and the two sides subtract date by date.
Steps
-
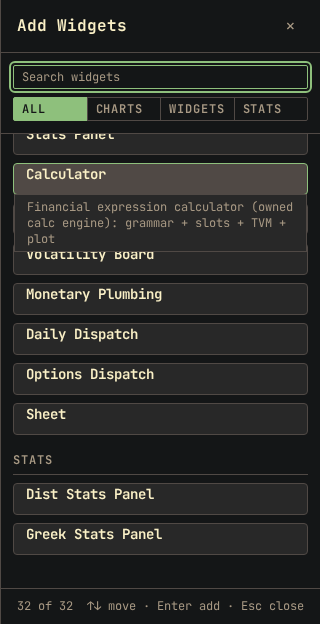
Click Add widget and select Calculator.
-
Type the correlation formula. The result line shows one number, computed only on the dates that both series have.
corr(iv30.series("SPY"), iv30.series("QQQ")) => a number from -1 to 1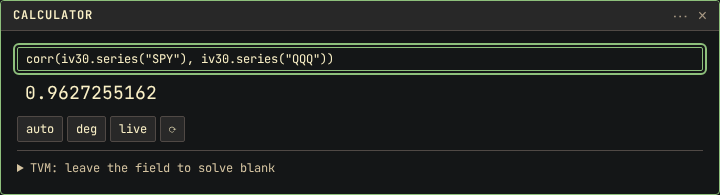
-
Replace the formula with the spread, QQQ minus SPY. A chart of the spread opens under the result.
align(iv30.series("QQQ"), iv30.series("SPY")) - align(iv30.series("SPY"), iv30.series("QQQ")) => a Series of daily spreads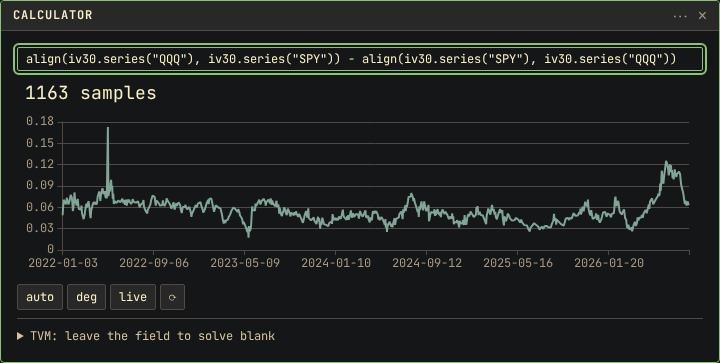
-
Wrap the spread in
zscorewith a window of 252 days.zscore(align(iv30.series("QQQ"), iv30.series("SPY")) - align(iv30.series("SPY"), iv30.series("QQQ")), 252) => a number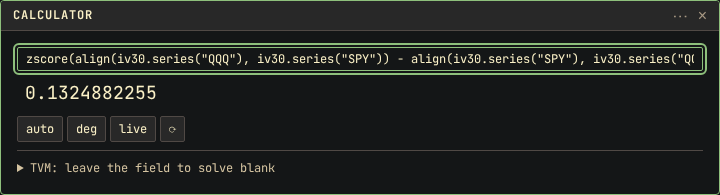
Result
- Correlation: how closely the two histories move together. Near 1, they rise and fall on the same days. Near 0, the movement of one series is unrelated to the other.
- Spread chart: the difference between the two series on each date.
- Z-score: today's spread compared with the last 252 trading days. Above 2 or below -2 means today's spread is rare for this pair.
Each formula uses history up to the previous trading day's close.
Other ways
In the Sheet
Sheet places each series in its own column, so each value is visible and available to further formulas.
-
Click Add widget and select Sheet.
-
Click A1 and type
=align(iv30.series("SPY"), iv30.series("QQQ")), then press Enter. -
Click B1 and type
=align(iv30.series("QQQ"), iv30.series("SPY")), then press Enter. -
Click C1 and type
=B1-A1, then press Enter. -
Click D1 and type
=corr(A1, B1), then press Enter. -
Click E1 and type
=zscore(C1, 252), then press Enter.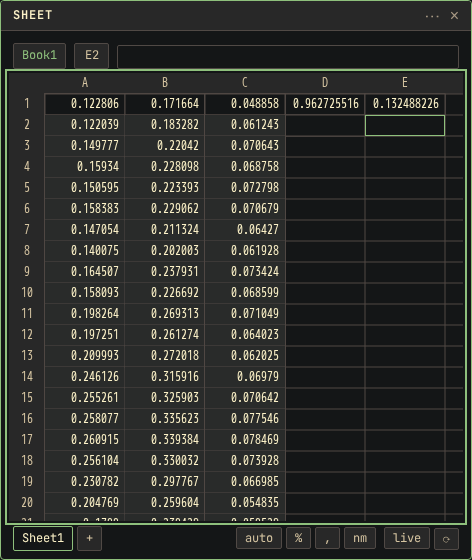
Columns A and B fill down one row per date. align keeps only the dates
that both series have, so each row shows the same day in both columns. A
reference to the top cell of a filled column, such as A1, passes the
whole column to a formula. =B1-A1 subtracts column A from column B
date by date, and the spread fills down column C.
Three or more series
With a third series, corr returns a matrix: one row and one column per
series, with 1 on the diagonal.
corr(iv30.series("SPY"), iv30.series("QQQ"), iv30.series("IWM")) => a 3 by 3 Matrix
In the Sheet the matrix fills a 3 by 3 block from the cell that contains the formula.
If something goes wrong
- "series have different dates": the two histories cover different
days. Wrap each side in
align, as in step 3. #SPILL!in the Sheet: a cell below the formula is not empty. Clear that column and press Enter on the formula again.#N/Aor "no data": the site has no history for that symbol. Check the symbol against the list in the symbol box.- Columns do not line up: one column was typed without
align. Usealignin both columns, with the other series as the second argument.