Read greek flow by strike
Read net vanna exposure by strike on Greek Flow, then set a tenor and read the same chain's totals in the Greek Stats Panel.
Goal
Read SPY's net vanna exposure by strike on Greek Flow. Then set one tenor and read that chain's totals in the Greek Stats Panel.
Before you start
Sign in and click Trader Dash in the top bar. The steps use SPY, the default symbol of Trader Dash. In each picture, the window was widened by dragging its right border.
Steps
-
Click + Add widget.
-
Under Charts, click Greek Flow.
-
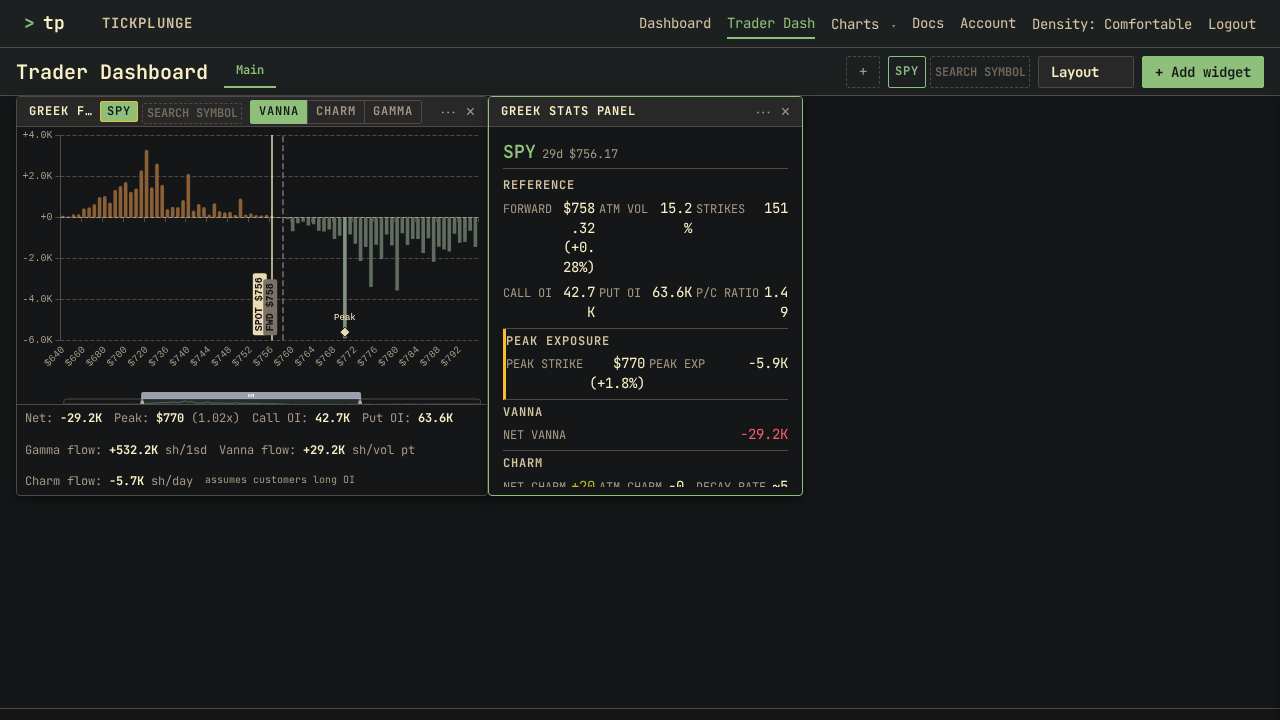
Under Stats, click Greek Stats Panel, then press Escape to close the picker. Greek Flow opens on Vanna. The Greek Stats Panel shows SPY and its 29d chain.
-
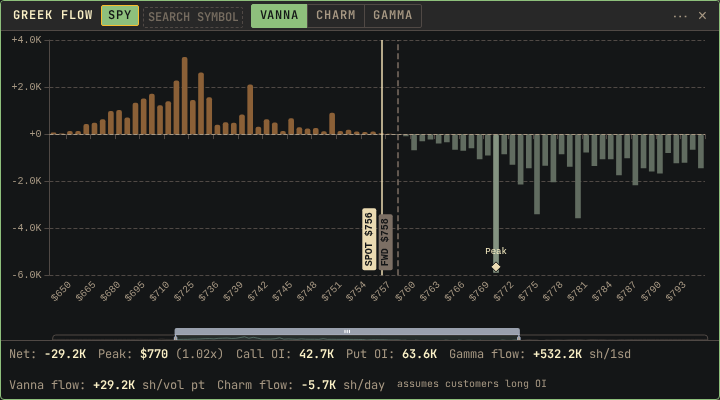
Read Greek Flow. Each bar is the net exposure at one strike. Lines mark SPOT and FWD, and a diamond marks the peak strike. The footer shows the totals.
-
On Greek Flow, click the widget menu button (⋯). Under Data, click 60d.
-
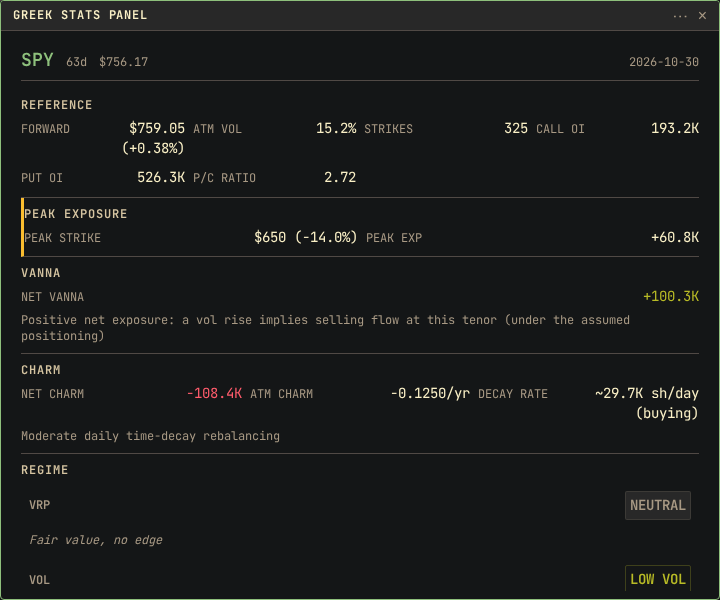
Read the Greek Stats Panel. Its context line now shows 63d, the chain nearest to 60 days.
Result
Greek Flow shows the hedging exposure that open interest creates at each strike. In the pictures the 29d chain has a net vanna of -29.2K. The footer shows Peak $770 (1.02x): the strike with the largest exposure, at 1.02 times spot. Call open interest is 42.7K and put open interest is 63.6K.
The Greek Stats Panel shows the totals for one chain. For the 63d chain in the pictures:
| Value | Shows |
|---|---|
| Peak Strike | $650, 14.0% below spot |
| Net Vanna | +100.3K |
| Net Charm | -108.4K |
| P/C Ratio | 2.72 |
| Forward | $759.05, 0.38% above spot |
Field definitions:
- Peak Strike: the peak exposure strike, the strike with the largest exposure.
- P/C Ratio: the put/call ratio, put open interest divided by call open interest.
- Forward: the forward price, the price of SPY at expiry implied by put-call parity.
Other ways
Other metrics
The Greek Flow header chips list Vanna, Charm and Gamma. Each chip has a hint that describes what a positive or negative bar means for hedgers. Gamma is never positive, because Greek Flow assumes that customers hold the options long.
Day over day
Under Data, Day lists Today and Yesterday. Yesterday draws the prior trading day for the reference chain only, the chain nearest 30 days. For any other tenor, the chart shows a notice in place of bars, such as Yesterday available for 29d only.
If something goes wrong
- The Greek Stats Panel shows a different tenor than you selected: it shows the chain nearest to the selected tenor. A 60d selection can show 63d.
- The Greek Stats Panel shows a different symbol than Greek Flow: the Greek Stats Panel uses the symbol of the Greek Flow window. Set the symbol on Greek Flow.
- The bars extend past the window: drag the slider under the chart to narrow the strike range.