Read the macro backdrop
Read one Macro Board section from its scores to the row that drives it, then open the chart for one Monetary Plumbing factor card.
Goal
Read the Funding section of the Macro Board from its scores down to the row that drives it. Then click the Corridor implementation card in Monetary Plumbing to open its chart in Drill-down.
Before you start
Sign in and click Trader Dash in the top bar. In each picture, the window was widened by dragging its right border. The Macro Board is taller than the page, so drag the right border near its top.
Steps
-
Click + Add widget. Under Widgets, click Macro Board, then press Escape to close the picker.
-
Leave the mode on Board. Widen the window until the Spark column shows.
-
Read the Funding subheader from left to right: stress, dislocation, coherence, model health and the date of the data.
-
Read the Read line under the subheader. It summarises the section.
-
Read the first row under the Read line. It is the row furthest from its own five-year norm.

-
Click + Add widget. Under Widgets, click Monetary Plumbing, then press Escape. Monetary Plumbing opens on Summary with eight factor cards.
-
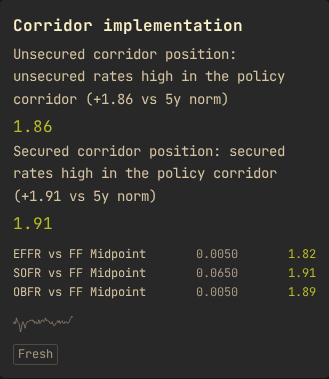
Find the Corridor implementation card and read its state lines.
-
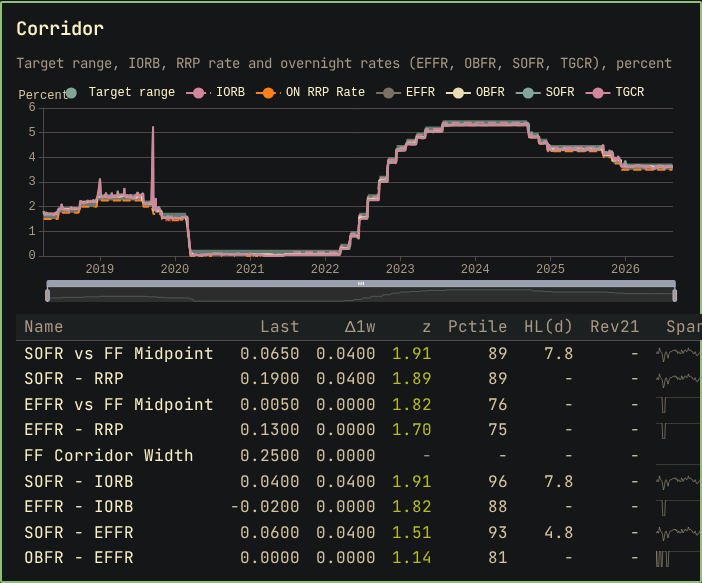
Click the card. The view switches to Drill-down, and the Corridor panel is highlighted.
Result
The Macro Board has nine sections: Funding, Fed corridor, Policy path, Releases, SOFR trailing averages, Treasury curve, Real & inflation, Credit and Monetary plumbing. In the pictures the Funding subheader shows Stress 93, Dislocation 92, Coherence 100 (High) and Model health 59, with data from 2026-10-29. The Read line states that the dislocation is in unsecured funding. It also states that secured funding pressure and the secured-unsecured basis confirm it.
The Funding rows are sorted by the size of their z-score: 1.91, 1.82, 1.51 and 1.14. The first row, SOFR minus IORB, is the furthest from its norm. Model health scores the reliability of the section's statistics today.
Monetary Plumbing shows one card per factor. In the pictures the Corridor implementation card shows two state lines. Unsecured rates are high in the policy corridor, at +1.86 against their five-year norm. Secured rates are also high, at +1.91. In Drill-down the Corridor panel charts the target range, IORB, the RRP rate and the overnight rates EFFR, OBFR, SOFR and TGCR. A strip of spreads, such as EFFR vs FF Midpoint, is shown under the chart.
Other ways
Ticker mode
The Macro Board header lists Board and Ticker. Ticker shows the same rows as a scrolling tape that fits a short window.
Windows and event studies
In Monetary Plumbing, the widget menu lists 1w, 4w, 13w and 52w under Data for the Drill-down charts. Research under View shows event studies. Select an event type there.
If something goes wrong
- A subheader field shows a dash, such as Coherence - (N/A): the run withheld that value. Hover the field to see the reason in its hint.
- Releases shows no scores: the Releases subheader shows a date only. Its rows show Month, Level, m/m and y/y, and no Releases row drives a section.
- A spark has a gap: the source published no value for that date.
- The Monetary Plumbing charts are missing: Summary and Research draw no charts. Set View to Drill-down.
- Research reports no path: the selected event has too few cases to publish. Select another event type.