Build a mean reversion model
Fit a mean reversion model to a short-rate spread in a Sheet: the fitted level, its speed of return, today's distance from it, and the chance of touching it.
Goal
Build a Sheet that fits a mean reversion model to the SOFR minus EFFR spread and shows five values:
- the level the spread returns to
- the speed of the return
- the distance of today's value from that level
- the chance the spread touches the level within 21 trading days
- the steadiness of the fit
Before you start
The model is the Ornstein-Uhlenbeck process: a series pulled back toward
a fixed level, faster the further it moves away, with random shocks. The
fit estimates three parameters from the history: the level (mu), the
speed of the pull (kappa, per year) and the size of the shocks
(sigma). Every other cell in this guide derives from those three.
The spread is SOFR minus EFFR, two overnight rates, in percent: 0.02
means two basis points. Every model function takes the series, then the
fit window. 252 fits on the last 252 points, about one trading year.
Steps
-
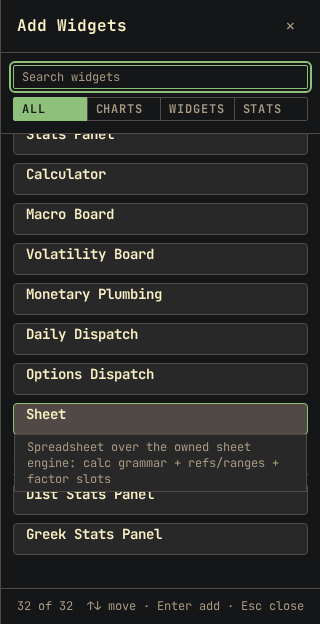
Click Add widget and select Sheet.
-
Type the labels into column A, one per row, from A1 to A6:
latest,level,half-life,z,touch 21d,steadiness.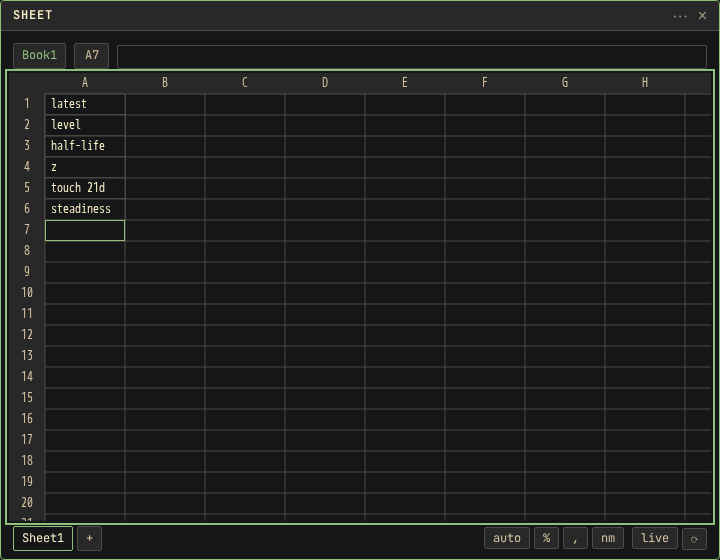
-
Click B1 and type the latest value, then press Enter.
iloc(fred.series("SOFR_minus_EFFR"), -1) => 0.02 -
Click B2 and type the fitted level, then press Enter.
ou.mu(fred.series("SOFR_minus_EFFR"), 252) => 0.0204765 -
Click B3 and type the half-life, then press Enter.
ou.halflife(fred.series("SOFR_minus_EFFR"), 252) => 3.81103 -
Click B4 and type the z-score against the model, then press Enter.
ou.z(fred.series("SOFR_minus_EFFR"), 252) => -0.00822099 -
Click B5 and type the chance of touching the level within 21 days, then press Enter.
iloc(ou.fpt(fred.series("SOFR_minus_EFFR"), 252, 21), -1) => 0.99766 -
Click B6 and type the steadiness of the fit, then press Enter.
ou.cv(fred.series("SOFR_minus_EFFR"), 252) => 0.327773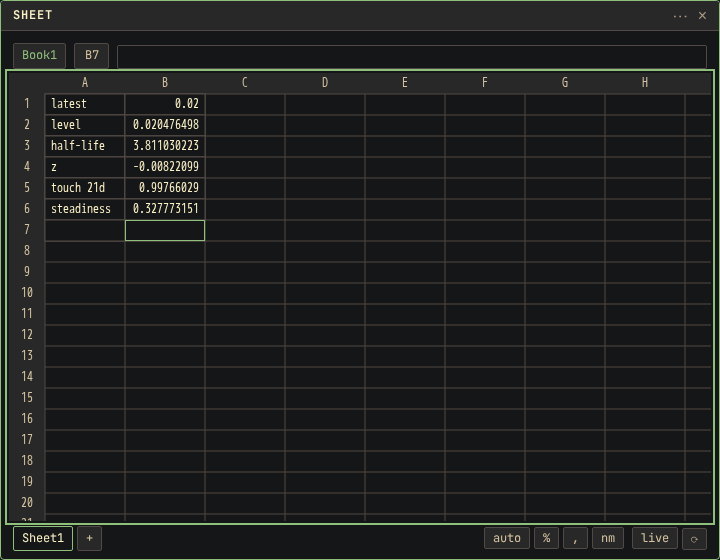
Result
Column B shows the following values:
- latest and level: on 2026-10-22 the spread closed at 0.02. The fitted level is 0.0205, so the spread is at its level.
- half-life: the number of trading days for half of a gap between the spread and its level to close, here 3.8. The remaining gap halves again in the next 3.8 days.
- z: the distance of the latest value from the level, in long run standard deviations. Near 0, the spread is where the model expects it. At -2 the spread is two long run standard deviations below the level, and the model expects a rise toward it. At +2 the model expects a fall.
- touch 21d: the chance the spread touches its level within 21 trading days. The value is near 1 here because the spread starts at the level.
- steadiness: the spread of the fitted speed across 20 refits, one per month back in time, divided by its mean. Lower is steadier. When the speed changes widely between refits, the fit describes the past year only and does not predict the spread.
The fit uses the history up to the latest observation in the site's data. FRED publishes each rate one day after its date.
Other ways
In the Calculator
The Calculator charts the expected path of the spread. ou.path returns
the expected value for each of the next 21 trading days.
-
Click Add widget and select Calculator.
-
Type the expected path. The chart under the result shows it.
ou.path(fred.series("SOFR_minus_EFFR"), 252, 21) => a Series of 21 expected values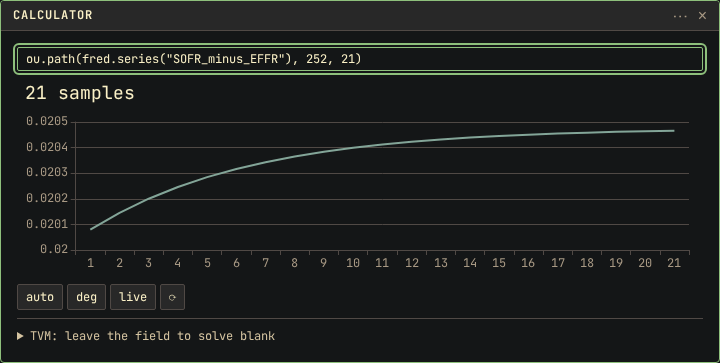
ou.pathsd returns the standard deviation around each day of that path.
ou(fred.series("SOFR_minus_EFFR"), 252) returns kappa, mu and
sigma as one column.
Refits back in time
ou.roll refits the model on windows that step back in time. It returns
one row per window, newest first: kappa, mu, sigma and the
half-life. In a Sheet cell, the four columns fill a block.
ou.roll(fred.series("SOFR_minus_EFFR"), 252, 126, 4) => a 4 by 4 Matrix
Size a trade
kelly(p, rr) converts a chance of winning p and a reward to risk
ratio rr into a fraction of capital. Use the touch chance as p only
when z is far from 0. On the example date the spread is at its level, so
the touch chance is near 1 and is not a usable p.
If something goes wrong
- Every cell shows
#N/A: the spread history has not loaded. Wait for the page to finish loading, then press Enter on B1 again. #ERRORon a model cell: the series does not revert over that window, so the model has no fit. Hover over the cell to display the message, then try a longer window.- The
ou.rollcell shows[4×4]and no block: a cell in the target block is not empty, so the matrix stays folded in its cell. Clear the 4 by 4 block whose top left corner is that cell, then press Enter on the cell again. A formula that refers to the cell uses the whole matrix in either state. - The half-life is very large: the series barely reverts over that
window. A slow series also scores a high
ou.r2. Judge the fit by the half-life and the steadiness, and ignoreou.r2.