Read the volatility surface
Read implied volatility by delta and tenor on Vol Surface 2D/3D, then click one cell to set Vol Smile and Term Structure to it.
Goal
Read SPY's implied volatility across delta and tenor on Vol Surface 2D/3D. Then click one cell to set Vol Smile to the cell's tenor and Term Structure to its delta.
Before you start
Sign in and click Trader Dash in the top bar. The steps use SPY, the default symbol of Trader Dash. In each picture, the window was widened by dragging its right border.
Steps
-
Click + Add widget.
-
Under Charts, click Vol Surface 2D/3D, Vol Smile and Term Structure.
-
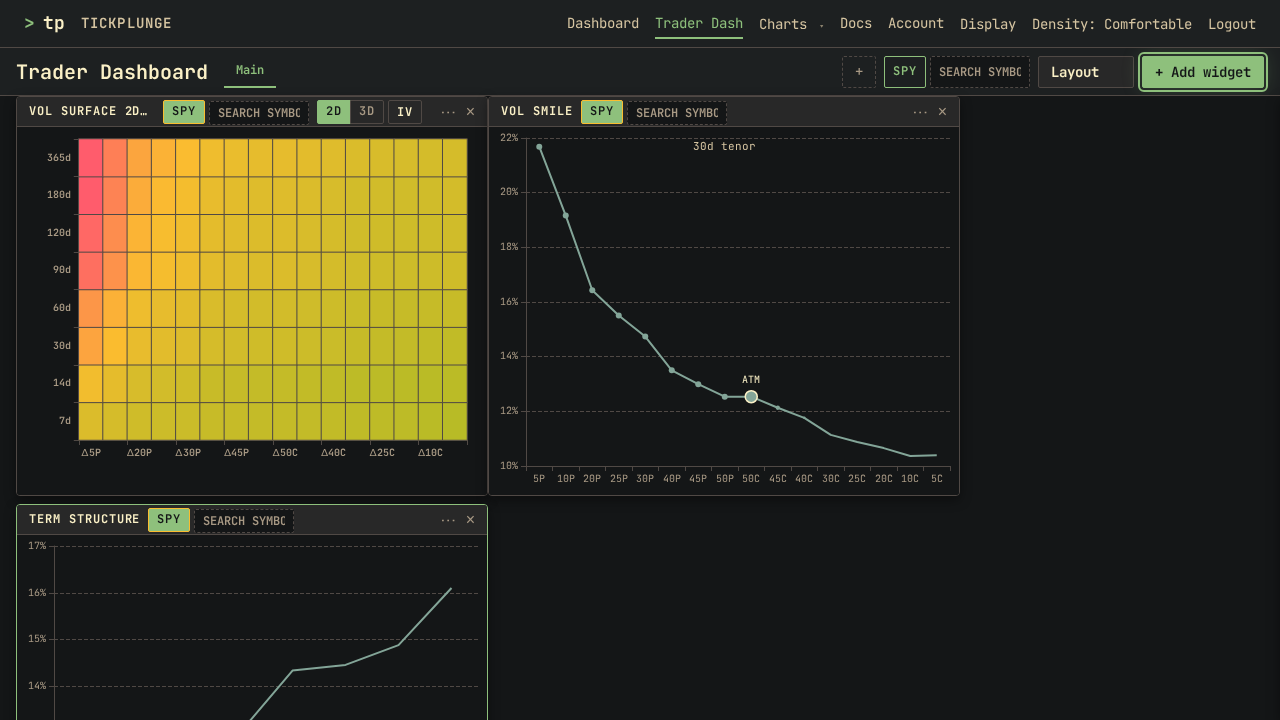
Press Escape to close the picker. Vol Surface 2D/3D opens in 2D on IV, Vol Smile on 30 days and Term Structure on ATM.
-
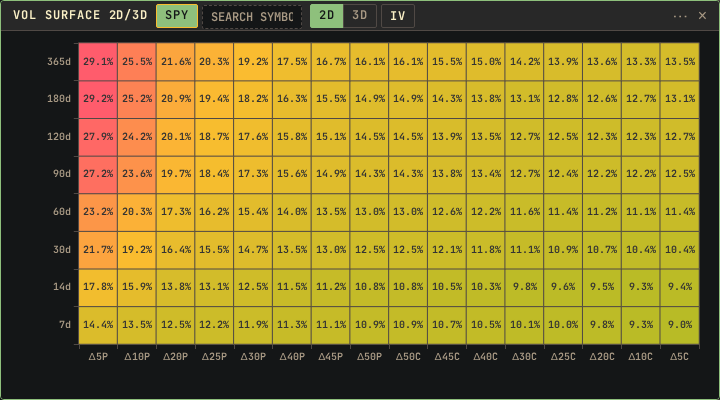
Read Vol Surface 2D/3D. Each row is a tenor, from 7d at the bottom to 365d at the top. Each column is a delta, and every cell shows its implied volatility.
-
Click the cell in the Δ25P column and the 60d row. In the pictures its value is 16.2%.
-
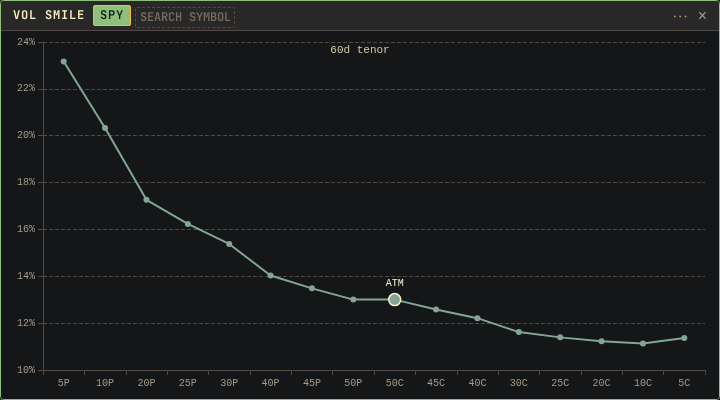
Look at Vol Smile. Its subtitle is now 60d tenor, and its line is the 60d row of the surface.
-
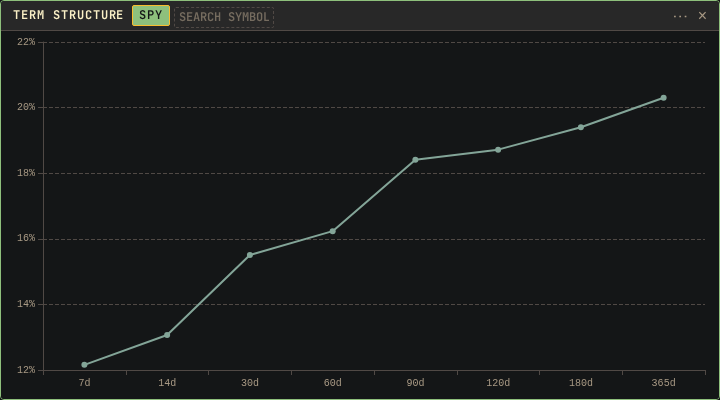
Look at Term Structure. Its line is now 25P IV across every tenor. The widget menu shows 25P checked under Data.
Result
Vol Surface 2D/3D shows implied volatility for every delta and tenor at once. Its columns run in strike order: from Δ5P on the left to Δ50P, then from Δ50C to Δ5C on the right.
In the pictures the highest values are on the far put wing at long tenors: about 29% at Δ5P for 180d and 365d. The 60d row runs from 23.2% at Δ5P to 13.0% at Δ50P, and from 13.0% at Δ50C to 11.4% at Δ5C.
Vol Smile draws one tenor across every delta. Its deltas run in the same order, 5P to 50P, then 50C to 5C. The ATM marker is on 50C, in the centre of the line.
Term Structure draws one delta across every tenor. After the click it draws 25P IV: 12.2% at 7d, 16.2% at 60d and 20.3% at 365d. Term Structure has no legend. To see which delta it shows, open its widget menu.
Other ways
Set the tenor or delta in each widget
Vol Smile and Term Structure each have a setting in their own widget menu. Vol Smile lists 7d, 14d, 30d, 60d, 90d, 120d, 180d and 365d under Data. Term Structure lists 10P, 25P, ATM, 25C and 10C.
Other views of the surface
The Vol Surface 2D/3D widget menu lists 2D and 3D under View. It also lists the value each cell shows: IV, Skew, VRP, Anomaly, CalArb and BflyArb.
If something goes wrong
- The click sets nothing: Vol Surface 2D/3D is in 3D. Only the 2D view sends a cell. Set View to 2D.
- Term Structure shows 25P after a Δ20P click: Term Structure groups deltas from 0.175 to 0.45 under 25P or 25C. Smaller deltas show as 10P or 10C. Deltas of 0.45 and above show as ATM.
- The delta on Term Structure is not shown: open its widget menu. The checked item under Data is the delta.