Scan the Volatility Board
Sort the Volatility Board by the measure you care about, read one symbol's row and its dashes, then open a symbol in VRP Series.
Goal
Sort the Volatility Board by Chance and by E-Move, read one symbol's row, and open a symbol in VRP Series.
Before you start
Sign in and click Trader Dash in the top bar. The steps add two widgets to the open tab.
Steps
-
Click + Add widget, then under Widgets click Volatility Board.
-
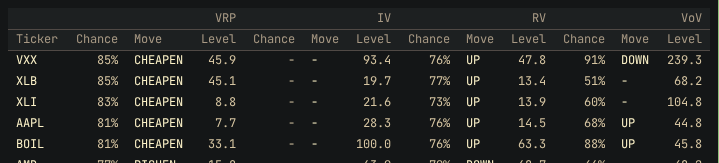
Press Escape to close the picker. The rows are sorted by VRP Chance, highest first. VXX and XLB share the top Chance of 85%.
-
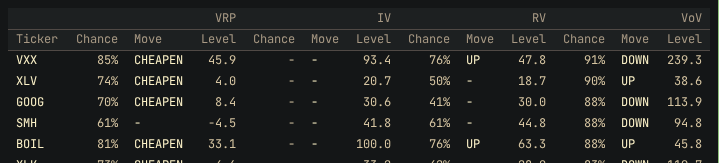
Click VoV in the header chips. The rows are sorted by VoV Chance. VXX is on top at 91%, and XLV is second.
-
Click VRP to sort by VRP Chance again.
-
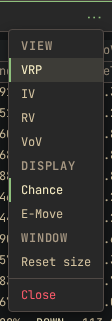
Click the widget menu button (⋯) at the top right of the widget, then under Display click E-Move.
-
Find the top row, AMD. Under VRP, Chance is 77%, Move is RICHEN and Level is -15.8.

-
Under IV on the same row, Chance and Move are dashes and Level is 63.9.
-
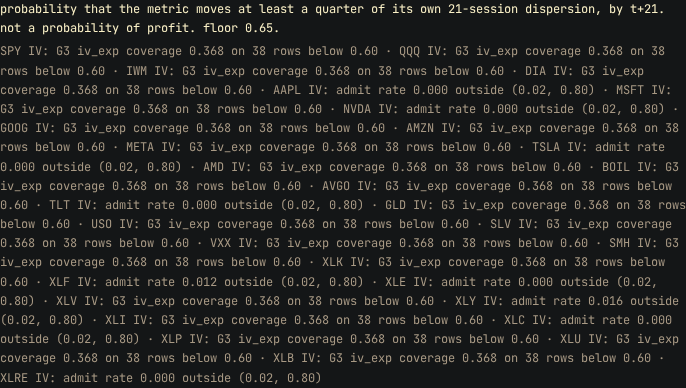
Read the footer below the last row. The footer lists a reason for the IV column of every symbol, AMD included.
-
Click + Add widget, then under Charts click VRP Series.
-
Press Escape to close the picker.
-
Click the search field in the VRP Series symbol row, type
QQQand press Enter. VRP Series shows QQQ.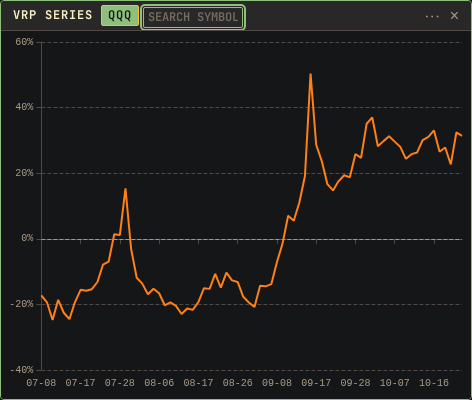
Result
AMD's row shows the following values:
- VRP Level -15.8: implied volatility excluding earnings is 15.8 vol points below the forecast of historical volatility.
- VRP Chance 77%, Move RICHEN: the model gives a 77% probability that VRP rises by a meaningful amount within 21 sessions.
- IV Level 63.9, Chance and Move dashes: 30-day implied volatility is 63.9. The model gives no forecast for IV on this row.
Chance is the move probability of the measure in that column. It does not measure the chance that a trade makes money.
The E-Move sort uses each row's median 21-session change. The Volatility Board does not display E-Move values. Rows with equal values stay in the order they arrive from the data.
Dashes
- Dash in Move only: the Chance is below the 0.65 floor shown in the footer, so the model gives no direction.
- Dashes in Chance and Move: the model rates the column unreliable, and the Volatility Board shows the level only. The footer lists the symbol, the measure and the reason for each such column.
For a premium seller, the VRP columns forecast whether the premium rises or falls. The row order is the sort you selected and does not rank trades. The Volatility Board does not suggest a strike, expiry or price.
VRP Series plots VRP as a ratio, so its values are not comparable with the vol points on the Volatility Board. The Volatility Board page describes each column.
All Volatility Board values are from the previous trading day's close. To read a straddle or strangle on one symbol, see From a card to an order ticket.
If something goes wrong
- The rows did not reorder after you selected E-Move: the sort applies to the highlighted measure chip. Check which chip is highlighted.
- A row moved to the bottom after a sort: the row has no value for that sort. Select the other sort or another chip.
- A whole group of cells shows dashes: there is no data for that symbol and measure.
- VRP Series still shows another symbol: Enter did not select the match. Click the search field, type the symbol again and press Enter.