Compare symbols
Draw up to three symbols on one chart, set one symbol for every widget at once, and compare one symbol's latest year with earlier years.
Goal
Draw SPY, QQQ and IWM together on one IV vs HV chart. Then draw SPY's latest year against the year before on the same chart.
Before you start
Open Trader Dash on a tab with room for one more widget. The steps use IV vs HV. Every chart with Compare in its widget menu works the same way:
- IV vs HV, VRP Series and Z-Score Histogram
- Term Structure, Vol Smile, Distribution and Forward Curve
- ATM Straddle and 25Δ Strangle
- VIX 30-Day, VIX 3-Month and VIX Basis
Steps
-
Click + Add widget, then under Charts click IV vs HV.
-
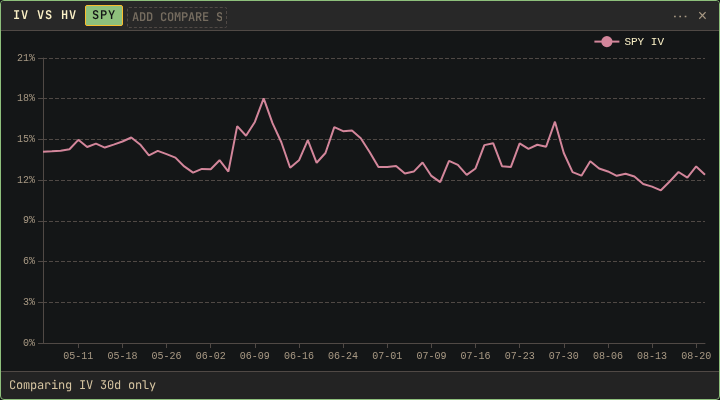
Press Escape to close the picker. IV vs HV draws one symbol.
-
Click the widget menu button (⋯) at the top right of the widget, then under Data click Compare.
-
Click the search field at the right of the symbol row and type
QQQ. -
Press Enter to add the highlighted match.
-
Type
IWMand press Enter. IV vs HV draws three symbols.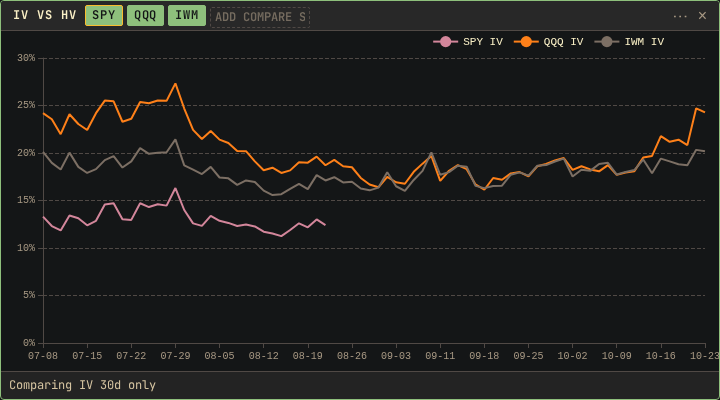
-
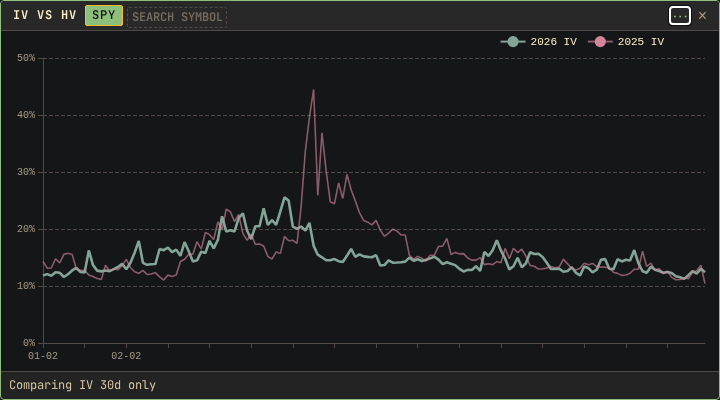
Open the widget menu again. Under Display, in Year overlay, click 1Y Overlay. Compare switches off.
Result
With Compare on, IV vs HV draws each symbol in the row as its own
line over the Range set in the widget menu. The lines show which
symbol is high or low against the others on the same dates. The search
field accepts at most three symbols. With three drawn, the list under it
shows Max 3 symbols.
With an overlay, IV vs HV draws one symbol's latest year over the years before it, on one axis. The lines show whether this year is above or below earlier years. Year overlay lists 1Y, 2Y and 3Y Overlay: the latest year against the one, two or three years before it. No Overlay turns the overlay off. The Range setting has no effect on an overlay.
Only one of the two views is active at a time. Turning Compare on clears the overlay, and selecting an overlay switches Compare off. IV vs HV, ATM Straddle and 25Δ Strangle handle Year overlay this way. VRP Series and Z-Score Histogram have their own Year overlay, from None to 3Y, described in Volatility context.
Other ways
One symbol for every widget
The symbol row is at the top of Trader Dash, beside Layout. On the
tab, it sets the symbol of every widget that follows the symbol row. Select
QQQ there, and each single-symbol widget redraws on QQQ.
Widgets with many symbols
Cross-asset widgets, such as IV/HV Scatter and VRP Correlation, draw many symbols. Their symbol row accepts up to 12 symbols. Click a symbol to hide it, and use the search field to add one.
If something goes wrong
- The widget menu has no Compare: that widget draws one symbol only. Use one of the charts listed under Before you start.
- The search field accepts no more symbols: three are already drawn. Click the × on a symbol to remove it first.
- The other symbols disappeared: selecting an overlay switched Compare off and removed the symbols you added. Turn Compare on and add them again.
- The overlay shows one line: the site has less than a year of history for that symbol before the current year.