Analyse one series
Show a symbol's latest value and its daily history in the Calculator, smooth the history, and compare today's value with its own past.
Goal
Show SPY's 30-day implied volatility in the Calculator as one number, as a daily chart, and as a 20-day average. Then compare today's value with its own past by z-score and by percentile rank.
Before you start
Open Trader Dash. This guide uses 30-day implied volatility. Every
other data function works the same way: hv30, vrp and the others in
the function reference.
Every data function has two forms. iv30("SPY") returns the latest
value. iv30.series("SPY") returns the daily history, one point per
trading day. Implied volatility is a decimal: 0.124 means 12.4%.
Steps
-
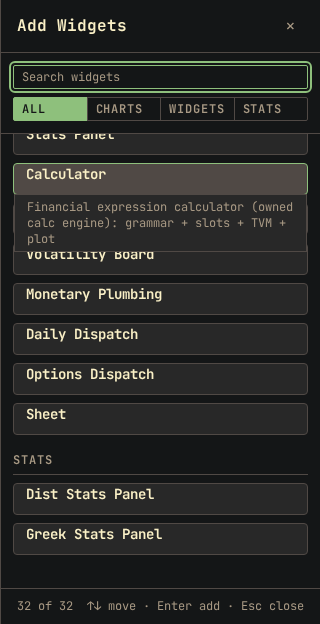
Click Add widget and select Calculator.
-
Type the formula for the latest value. The result line shows one number.
iv30("SPY") => 0.124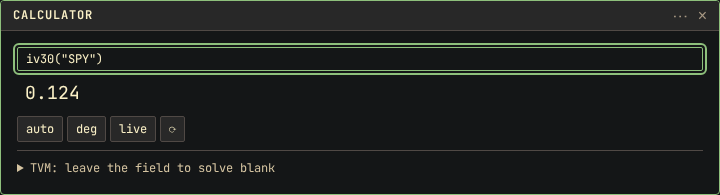
-
Add
.seriesafteriv30. A chart of the daily history opens under the result.iv30.series("SPY") => a Series of daily values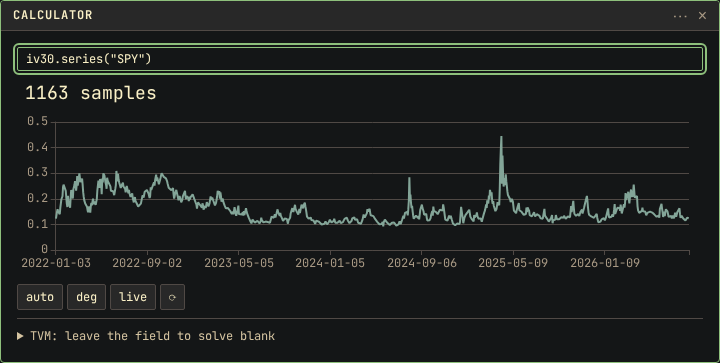
-
Wrap the history in a 20-day rolling average. The chart redraws with a smoother line.
mean(roll(iv30.series("SPY"), 20)) => a Series of 20-day averages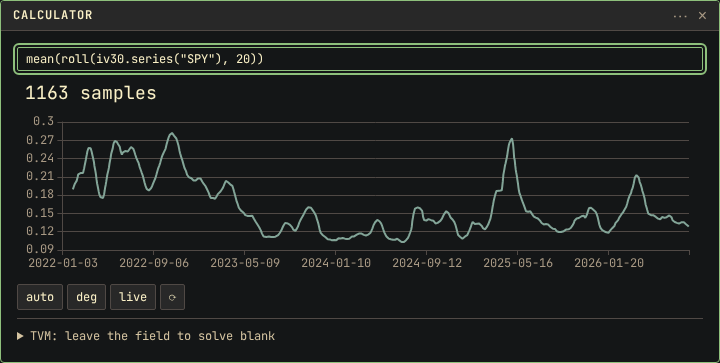
-
Replace the formula with the z-score over the last 252 trading days.
zscore(iv30.series("SPY"), 252) => -0.767269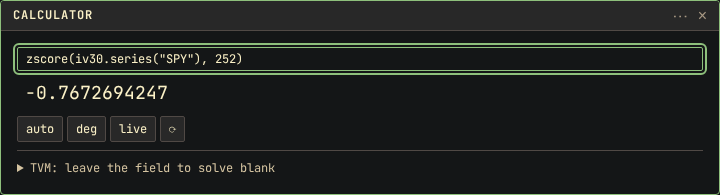
-
Replace the formula with the percentile rank over the same 252 days.
pctile(iv30.series("SPY"), 252) => 17.8571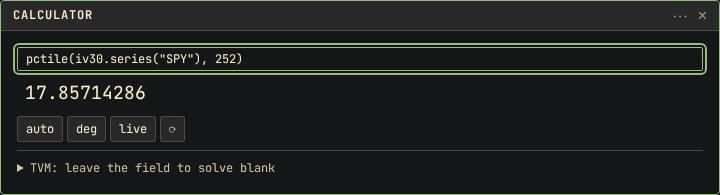
Result
The history chart shows implied volatility for every trading day in the site's data. The 20-day average removes day-to-day noise. Its first 19 points are empty, because a 20-day average needs 20 days.
The z-score and the percentile rank both show whether today's value is high or low for this symbol:
- Z-score: the number of standard deviations from the 252-day mean. -0.77 is below the mean and inside the normal range. A value beyond 2 or -2 is rare.
- Percentile rank: the share of the last 252 days at or below today. 18 means today is higher than about a fifth of the past year.
Use the percentile rank when the history has long quiet stretches and sudden spikes. One spike widens the standard deviation. The rank does not depend on the size of the spike.
Each formula uses history up to the previous trading day's close.
Other ways
In the Sheet
Sheet places the history in a column, one row per day, for further formulas.
-
Click Add widget and select Sheet.
-
Click A1 and type
=iv30.series("SPY"), then press Enter. -
Click B1 and type
=mean(roll(A1, 20)), then press Enter. -
Click C1 and type
=iloc(A1, -1), then press Enter. -
Click D1 and type
=zscore(A1, 252), then press Enter.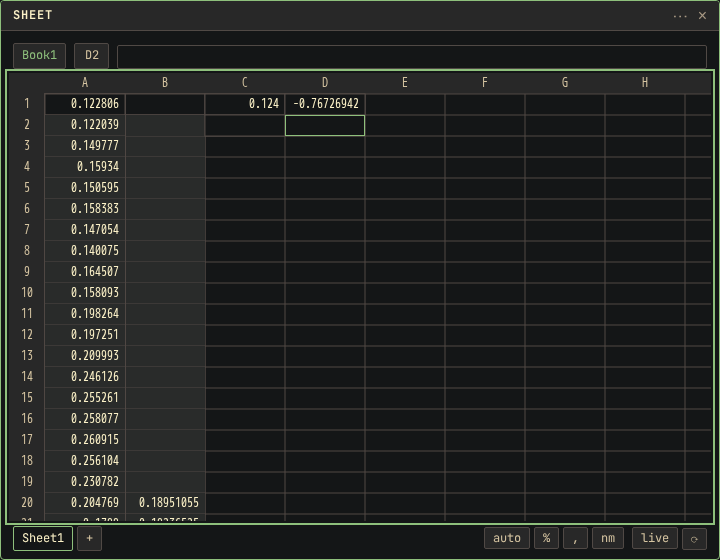
Column A fills down one row per trading day, with the oldest date at the
top and the latest at the bottom. A1 passes the whole column to a
formula, so column B shows the 20-day average beside each day. The first
19 rows of column B are empty. iloc(A1, -1) returns the last row, the
latest value. iloc(A1, -2) returns the day before.
One past date
at returns the value on a given date. On a weekend or a holiday it
returns the last close before that date.
at(iv30.series("SPY"), "2026-08-01") => 0.1259
If something goes wrong
- The result shows
E_NO_DATA: the site has no history for that symbol, or the data has not loaded yet. Check the symbol, then edit the formula once to run it again. - The Calculator chart is empty for its first weeks: a 20-day window has no value for its first 19 points.
#SPILL!in the Sheet: a cell below the formula is not empty. Clear that column and press Enter on the formula again.=iv30(A2)shows#ERROR: a data function needs its symbol typed in quotes, such as=iv30("SPY"). It does not accept a cell reference as the symbol.